Vegas Never Doubted Clayton Kershaw
 |
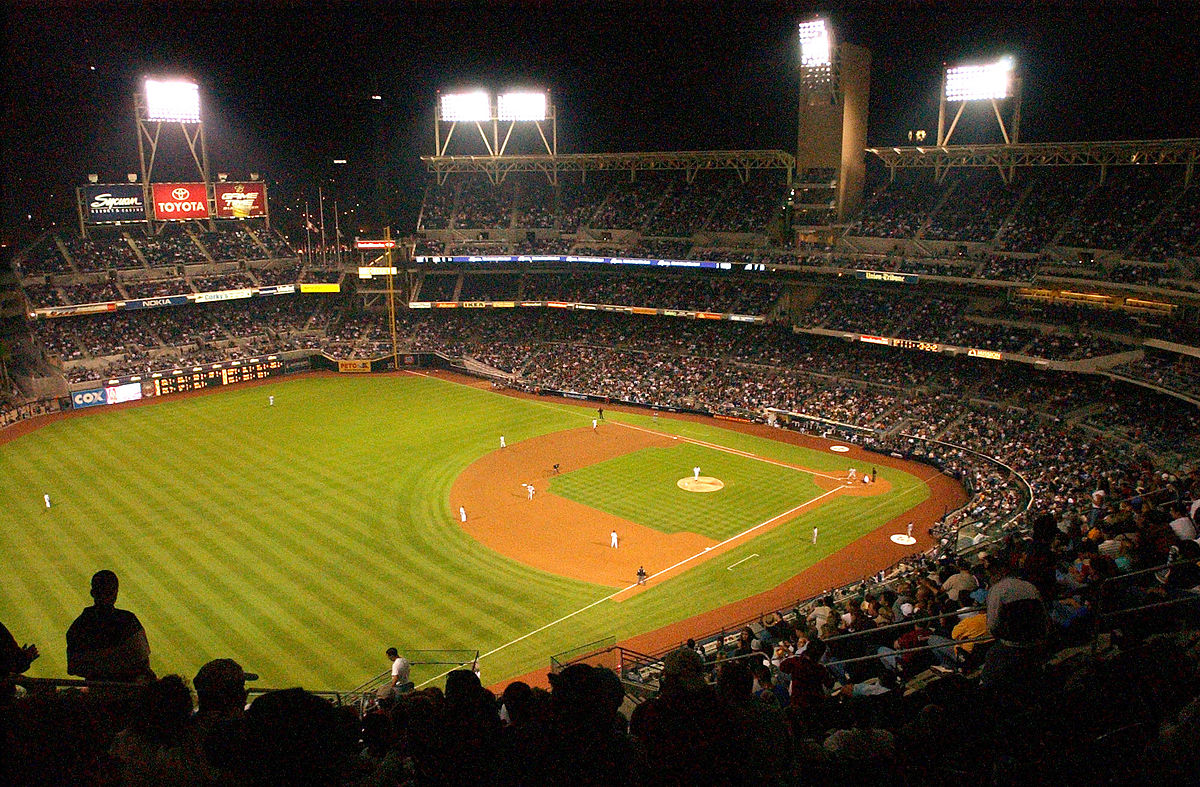
| San Diego's Petco Park The most "pitcher friendly" park in the league according to the market |
The Los Angeles Dodgers currently sit atop the market based rankings, despite having just the sixth best record in the league.
Ranking Starting Pitchers
In addition to the standard team rankings, I can also derive a ranking of starting pitchers. Each MLB team is more like 5 to 6 distinct teams, depending upon who takes the mound to start. According to the market, the best pitcher in the league is, and has been, the Dodgers' Clayton Kershaw. Teams facing Kershaw are expected to score 1.27 less runs on average when compared to a league average starter. And despite Kershaw's early season bout with mediocrity, the market didn't blink. Kershaw has remained the top ranked pitcher throughout the season according to my Vegas rankings (check the sparkline next to each starter in the ranking table for a snapshot of their season progression).Ballpark Factors
Unlike the NBA or the NFL, where meaningful variations in home venues are practically nonexistent (save for perhaps cold weather effects in the NFL), where an MLB game is played has almost as much impact on runs scored as who is playing in it. There are "hitters parks", such as the Rangers' Globe Life Park, with limited foul territory and thin Texas air. And there are "pitchers parks" like the Padres' Petco Park, with its deep power alleys and higher sea level air density.Using the same betting information, I derived implied market-based "ballpark factors" for each team's park. Factors were derived from running a linear regression on the betting run total, and controlling for the teams and starters playing in each game. I ran these separately for each season and have summarized the results in the ballpark section of the rankings. The factor tells you how much higher or lower the combined run total would be due to playing in that particular park. These are still somewhat noisy from year to year, but far more stable than an analysis run off of actual runs scored.
Note the progression of the Rockies' Coors Field ballpark factor. In 2004 and 2005, their park added more than three runs to the betting run total. The market corrected sharply in 2006, reducing the expected run total to just over a run, where it stayed from 2006 to 2011. In recent years though, that number has begun to climb. For 2015 season-to-date, the implied factor is 2.30 runs.
An important callout is that the offense, defense, and starting pitcher rankings are adjusted for ballpark factors, meaning that any advantage or disadvantage a team or pitcher has by playing half of its games in a hitters/pitchers park is pulled out of the rankings. For the 2015 rankings, I use a weighted average of 2014 and 2015 betting results to create the ballpark factors. Those can be found in the last column of the team rankings table.


Leave a Comment